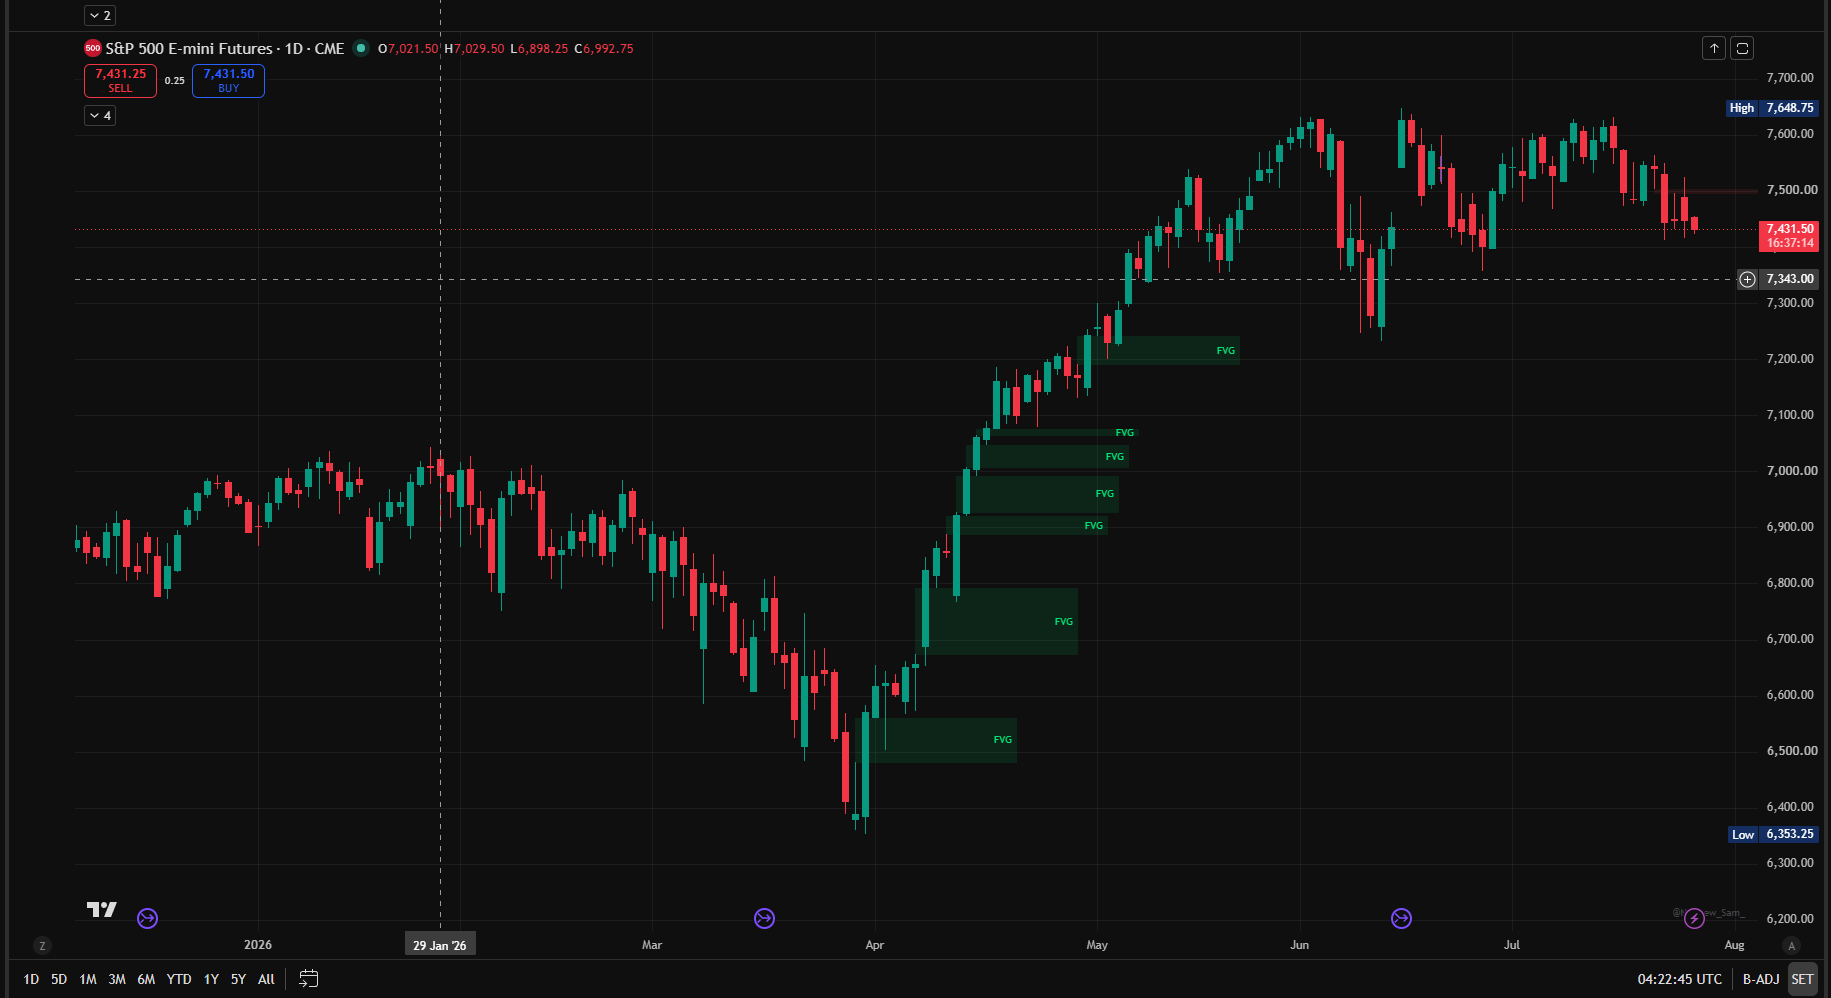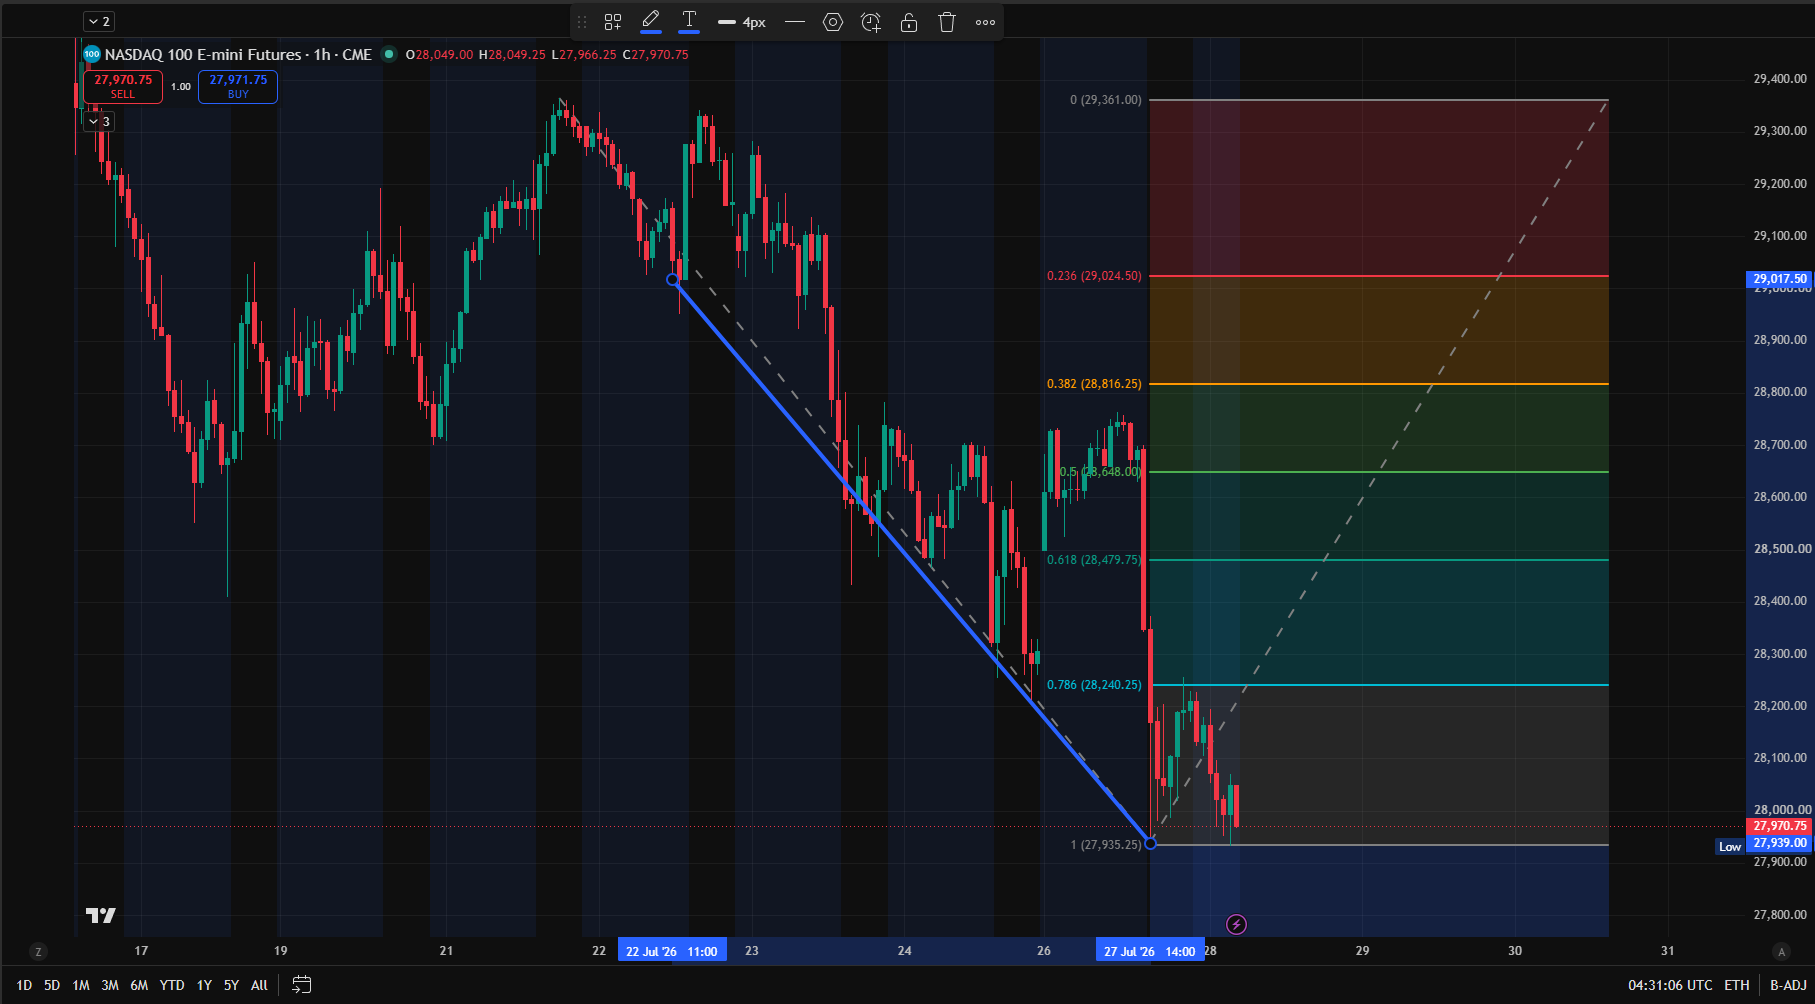
Support and resistance are fundamental concepts in technical analysis, yet they remain one of the most misunderstood aspects of chart reading for new traders. Understanding how to identify genuine support and resistance levels can transform your trading decisions and help you avoid costly mistakes.
What Support and Resistance Actually Are
Support is a price level where buying interest has historically prevented the price from falling further. Resistance is a price level where selling interest has historically prevented the price from rising further.
The key word here is “historically.” These levels aren’t magical barriers—they’re zones where traders have previously shown interest in buying or selling, and that behavior often repeats.
Common Mistakes New Traders Make
1. Treating Every Minor Touch as a Level
Many new traders draw support and resistance lines based on every single candle that touches a price level. This creates a cluttered chart filled with lines that don’t actually matter.
The reality is that support and resistance must be tested multiple times to become meaningful. A price level that price touches once and moves through isn’t necessarily a true level of interest.
2. Ignoring Volume and Market Context
Support and resistance are stronger when they align with volume spikes or key market events. A level that held during heavy volume is more significant than one that held during light trading.
3. Confusing Different Timeframes
A support level on the daily chart may be completely irrelevant on a 4-hour chart, and vice versa. New traders often forget that each timeframe tells a different story, and levels that matter on one timeframe may not matter on another.
4. Drawing Lines That Are Too Exact
Price rarely hits exact numbers. Support and resistance are zones, not single lines. Drawing a line at exactly 5500.00 and expecting price to reverse at that precise level is unrealistic. Instead, think of levels as ranges.
How to Identify True Support and Resistance
Look for multiple tests: A level that price has tested 3+ times is far more meaningful than one that’s been tested once.
Watch for volume: Support and resistance levels that coincide with volume spikes are more reliable.
Consider the timeframe: Identify levels on the timeframe you trade. A daily support level should be confirmed on the 4-hour chart.
Look for structure: Support and resistance often form at swing highs and swing lows—the turning points where price changed direction.
Respect the context: Is the market in an uptrend, downtrend, or range? This affects how support and resistance behave.
The Difference Between Broken and Held Levels
When price breaks through a support level decisively, that level often becomes resistance on the next bounce. This is called “polarity flip” and is one of the most reliable patterns in technical analysis.
The key word is “decisively.” A brief touch that closes back above the level is different from a confirmed break with volume.
Practice Exercise
Pull up a chart of a market you’re interested in. Identify three support levels and three resistance levels based on historical price action. Don’t draw lines for every touch—only draw lines for levels that price has tested multiple times or that coincide with significant volume.
Then, watch how price interacts with these levels over the next week. Do they hold as you expected? Do they break? What happens after?
This practical observation is far more valuable than any explanation.
Final Thoughts
Support and resistance mastery comes from practice and observation, not from memorizing rules. The more you study price action and watch how traders respond at key levels, the better you’ll become at identifying genuine support and resistance.
Remember: the chart is showing you a history of buyer and seller behavior. Support and resistance are simply the prices where that behavior has been most obvious.
SkyVestments content is provided for educational and informational purposes only and is not financial or investment advice. Markets involve risk, and individuals should make their own informed financial decisions.
Educational Disclaimer: SkyVestments content is provided for educational and informational purposes only and is not financial or investment advice. Markets involve risk, and individuals should make their own informed financial decisions.