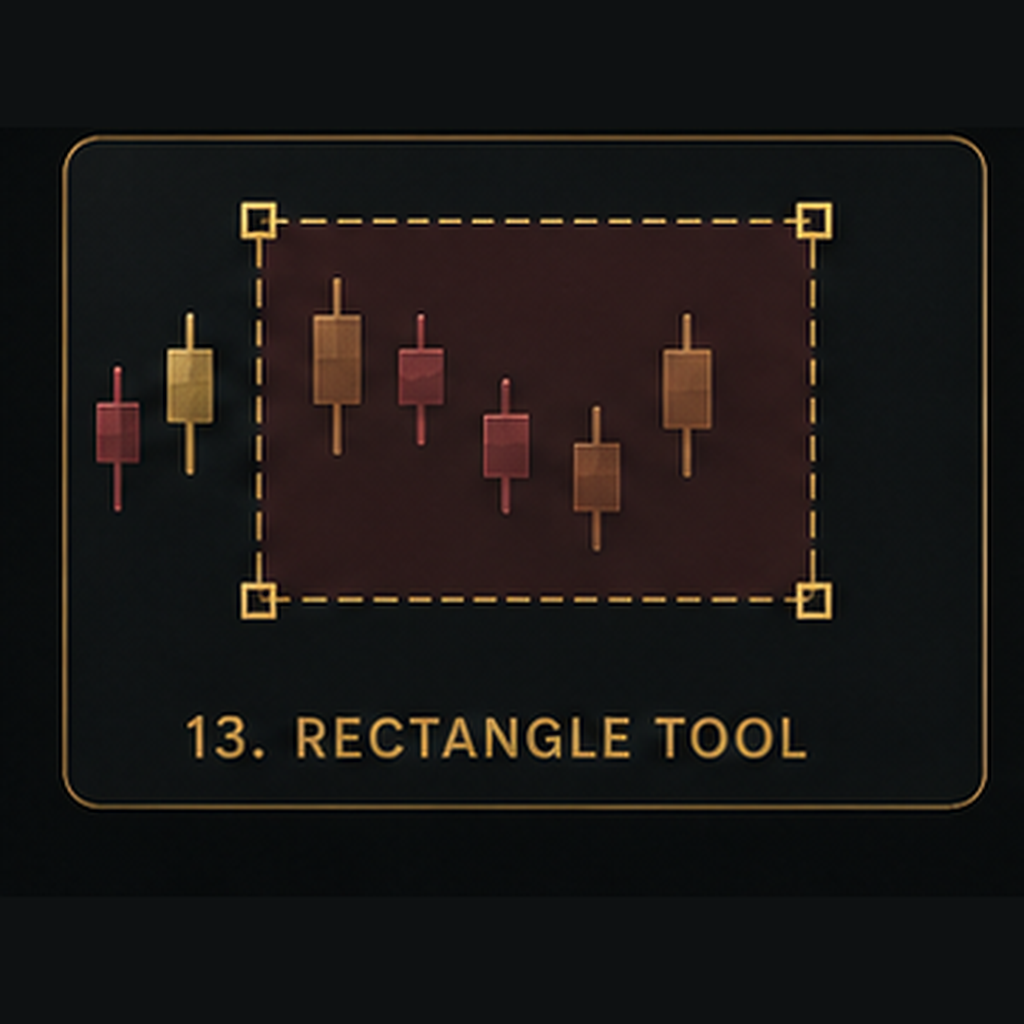
Rectangle Tool
Mark entire price zones instead of single lines to track support, resistance, and areas of interest.
What It Does
The Rectangle Tool allows traders to mark an entire price area on the chart instead of relying on one exact horizontal line. This is useful because support, resistance, supply, demand, consolidation, and reaction areas often behave more like zones than one exact price.
How to Use It
Select the Rectangle Tool and draw a box around the price area you want to track. Extend the rectangle forward when you want to continue monitoring that zone as price develops.
Use rectangles to mark:
- • Support zones
- • Resistance zones
- • Supply areas
- • Demand areas
- • Consolidation ranges
- • Breakout zones
- • Fair Value Gaps
- • Important reaction areas
- • Areas where price repeatedly accepts or rejects
Keep the zone focused around the price area that matters. Avoid making rectangles so large that they cover too much of the chart and lose their usefulness.
Use Rectangle zones together with market structure, trend, volume, price action, and other confirmation rather than treating every marked area as an automatic trade signal.
Video Lesson
A video lesson demonstrating the Rectangle Tool in action will be added soon. Check back later for step-by-step examples of how to use this tool effectively in your chart analysis.