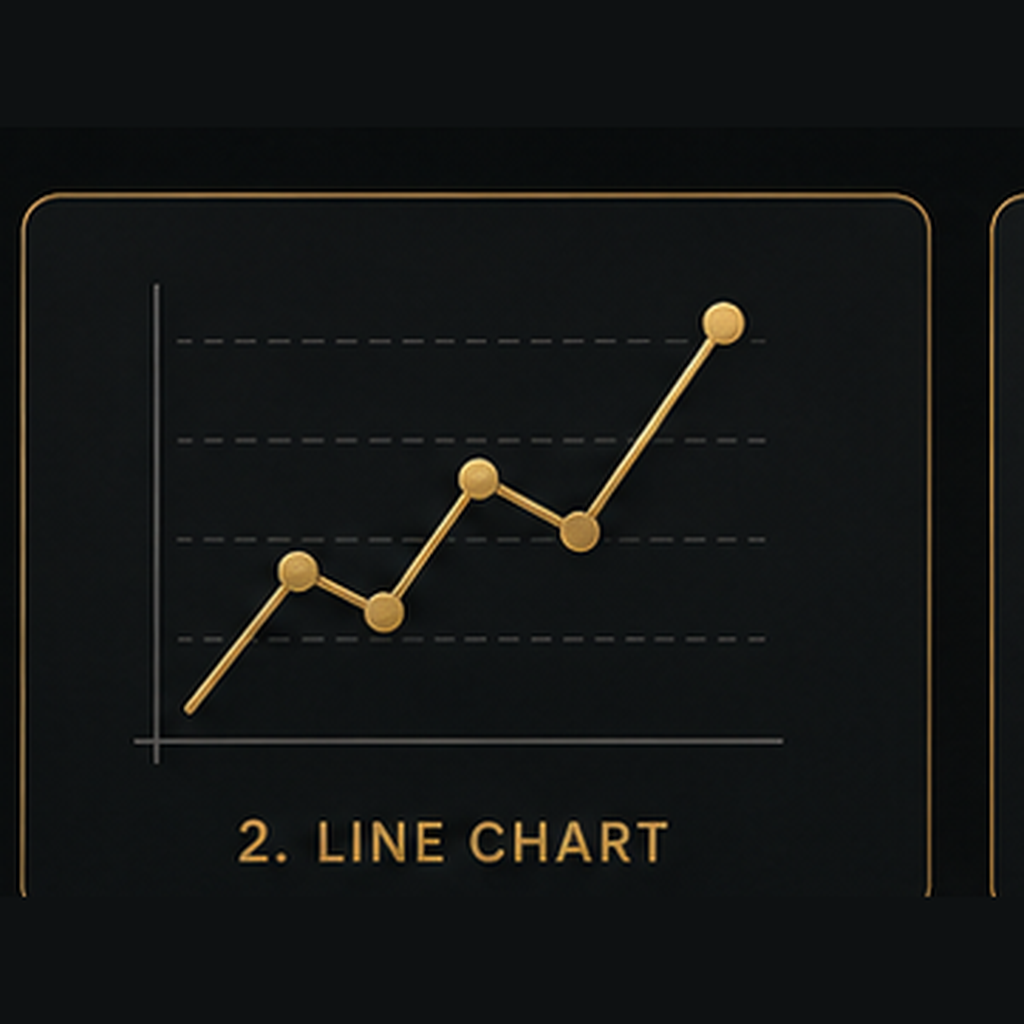
Line Chart
A simpler view of price action that helps you see the overall trend without extra candle detail.
What It Does
A Line Chart simplifies price action by connecting price points over time, commonly using closing prices. It removes much of the candle-by-candle detail and makes the overall direction and trend of the market easier to see.
How to Use It
Switch the chart display from candlesticks to a Line Chart when you want a cleaner view of overall market direction. Use it to study trends, major highs and lows, longer-term structure, and price movement without the extra detail of individual candles.
Video Lesson
A video lesson demonstrating the Line Chart in action will be added soon. Check back later for step-by-step examples of how to use this tool effectively in your chart analysis.