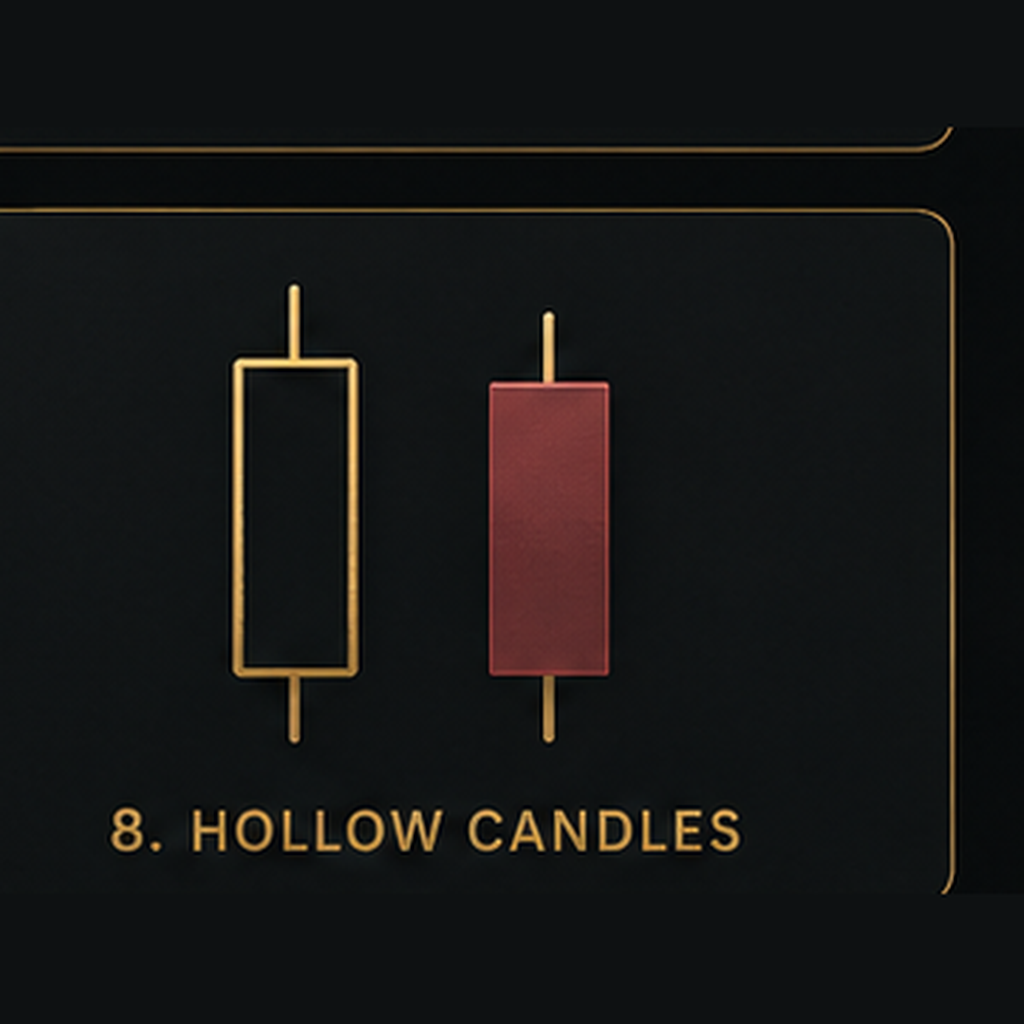
Hollow Candles
A chart display that uses hollow and filled candle bodies to show momentum and price behavior.
What It Does
Hollow Candles provide another way to read price action by using both candle color and whether the candle body is hollow or filled. This gives traders additional visual information about how the current candle opened and closed and how price compares with the previous candle.
How to Use It
Switch the chart style to Hollow Candles and study the candle body, color, open, close, high, and low. Hollow and filled candles can make shifts in momentum and buying or selling pressure easier to recognize visually.
Pay attention to:
- • Hollow candles during advancing price
- • Filled candles during declining price
- • Changes from hollow to filled
- • Changes in candle color
- • Wick size and rejection
- • Sequences of candles around support and resistance
- • Changes in appearance during trend shifts
Use Hollow Candles to help read price behavior and momentum, but combine them with market structure, trend, volume, and other confirmation rather than treating one candle by itself as a trade signal.
Video Lesson
A video lesson demonstrating Hollow Candles in action will be added soon. Check back later for step-by-step examples of how to use this tool effectively in your chart analysis.