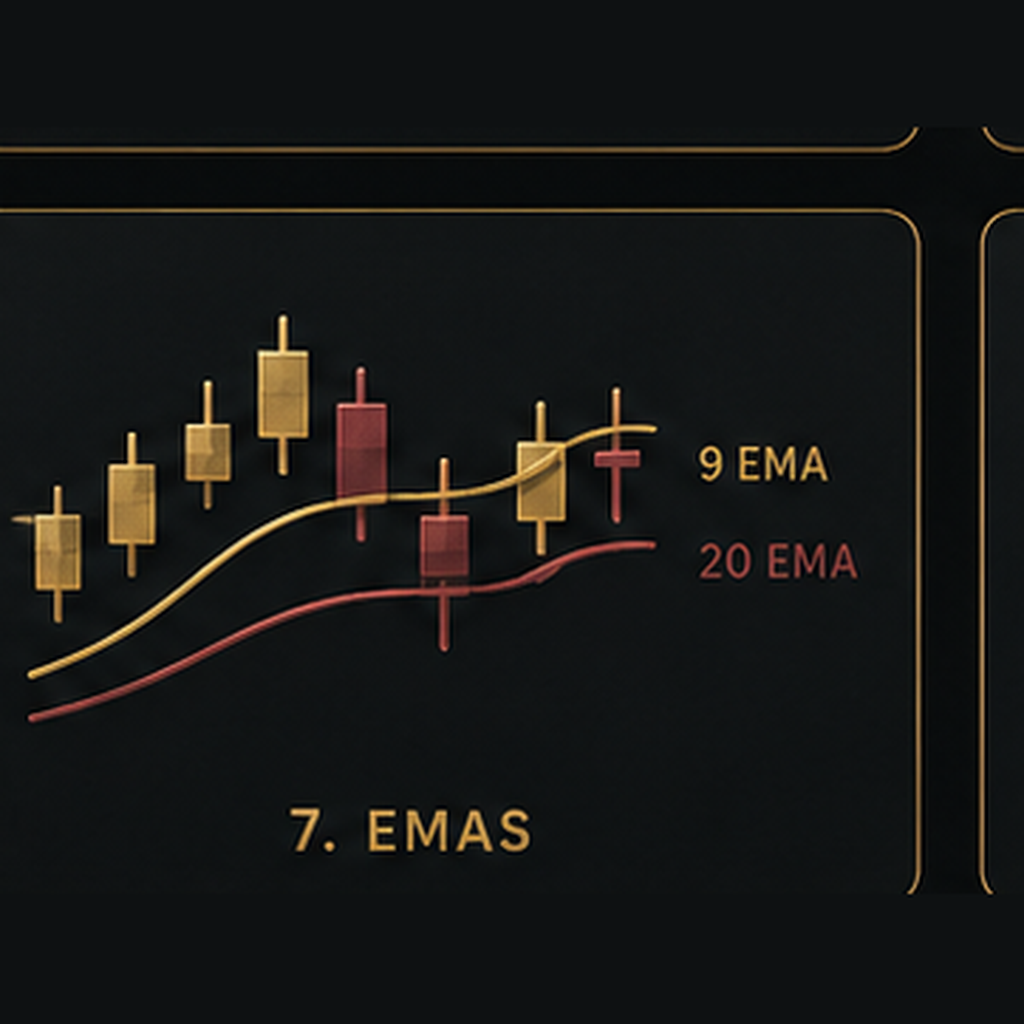
Exponential Moving Averages — EMAs
A technical indicator that tracks average price while giving more weight to recent market movement.
What It Does
An Exponential Moving Average, or EMA, tracks the average price over a selected period while giving more weight to recent price movement. Because newer prices carry more influence, an EMA can react faster to changing market conditions than a simple moving average.
How to Use It
Add one or more EMAs to the chart and watch how price behaves around them. Traders commonly use EMAs to help study trend direction, momentum, pullbacks, and changes in market structure.
Watch for:
- • Price trading above or below the EMA
- • The direction and slope of the EMA
- • Pullbacks toward the EMA
- • Price reclaiming or losing an EMA
- • Shorter EMAs crossing longer EMAs
- • Areas where price repeatedly reacts around an EMA
Different EMA lengths respond differently to price. Shorter EMAs react faster to recent movement, while longer EMAs provide a smoother view of the larger trend.
Use EMAs together with price action, market structure, support and resistance, volume, and other confirmation rather than treating an EMA crossover or touch as an automatic trade signal.
Video Lesson
A video lesson demonstrating Exponential Moving Averages in action will be added soon. Check back later for step-by-step examples of how to use this tool effectively in your chart analysis.