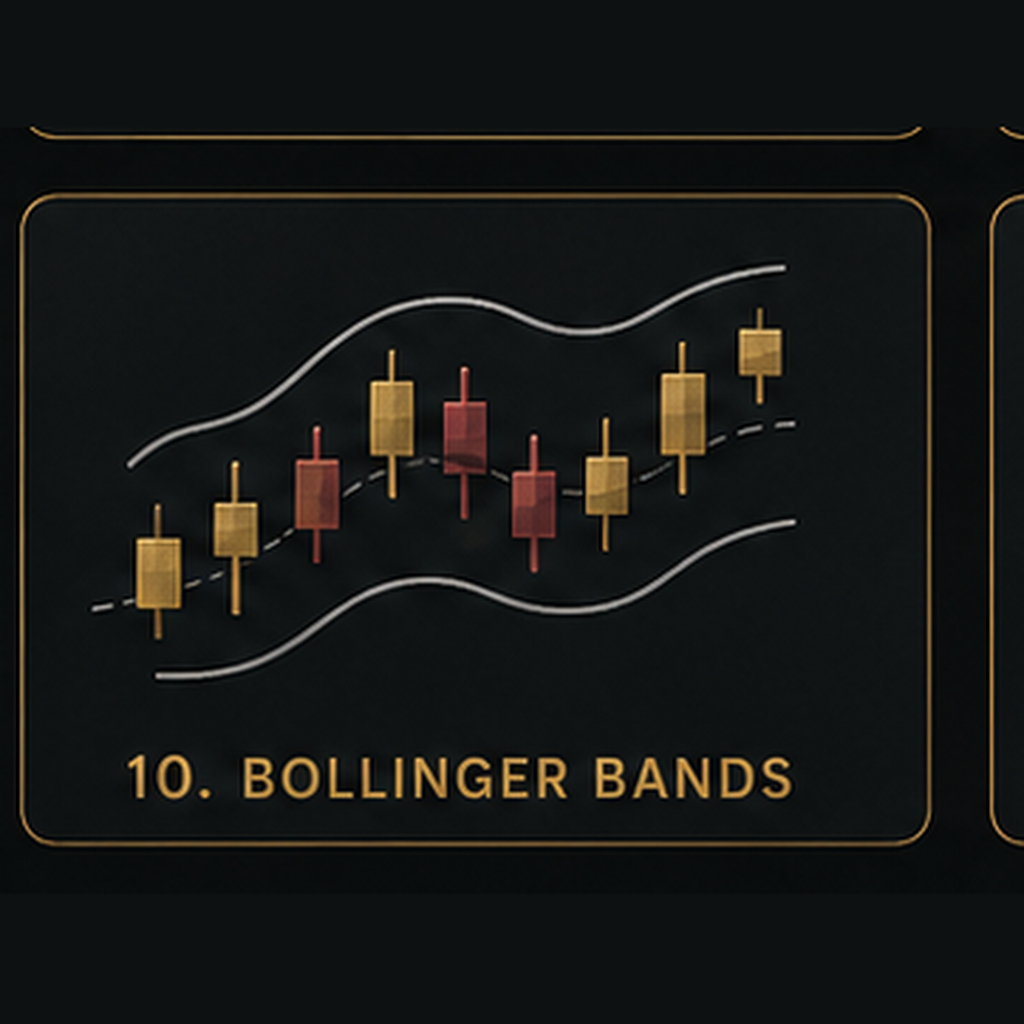
Bollinger Bands
A volatility-based indicator that shows changing market conditions and price location.
What It Does
Bollinger Bands are a volatility-based indicator built around a moving average with an upper band and a lower band. The distance between the bands expands and contracts as market volatility changes, helping traders see when price movement is becoming more active or more compressed.
How to Use It
Add Bollinger Bands to the chart and observe how price behaves relative to the upper band, middle moving average, and lower band.
Pay attention to:
- • Bands expanding as volatility increases
- • Bands contracting during lower-volatility periods
- • Price moving near the upper band
- • Price moving near the lower band
- • Price returning toward the middle band
- • Tight band compression before stronger movement
- • Breakouts outside the bands
- • Price reactions when combined with support, resistance, trend, or market structure
A price touching an upper or lower band does not automatically mean the market will reverse. Use Bollinger Bands as a volatility and price-location tool together with price action, structure, volume, and other confirmation.
Video Lesson
A video lesson demonstrating Bollinger Bands in action will be added soon. Check back later for step-by-step examples of how to use this tool effectively in your chart analysis.