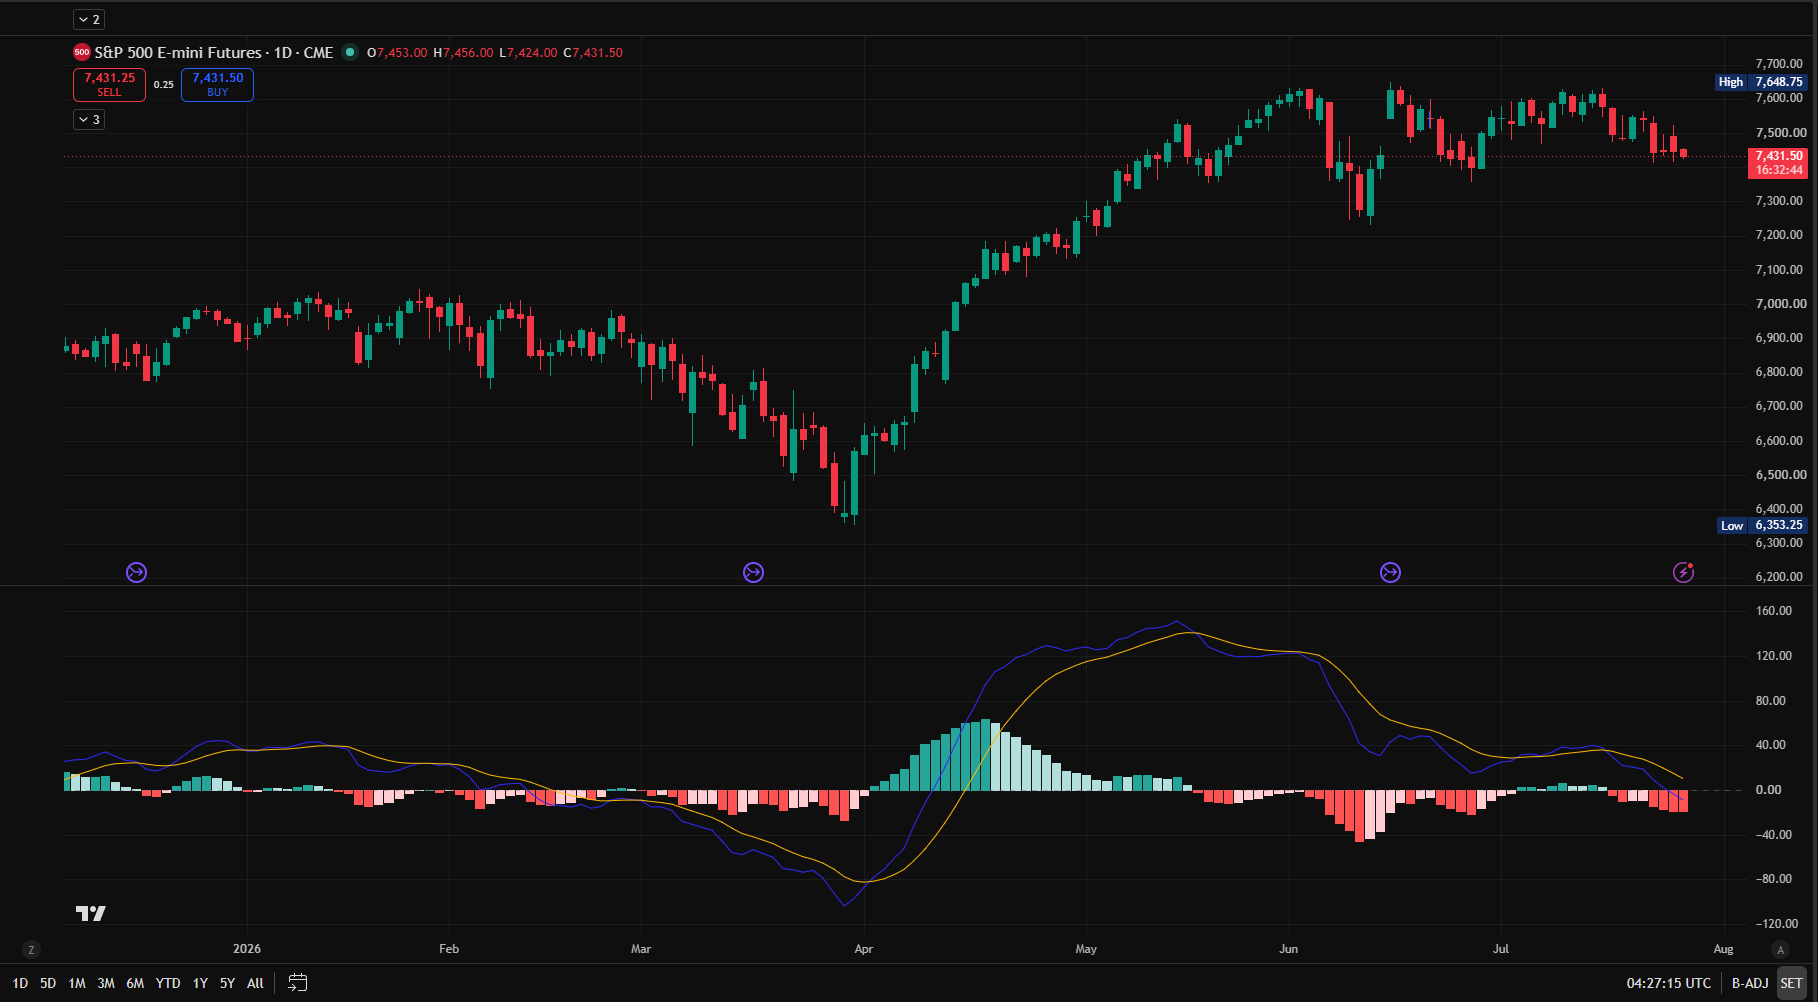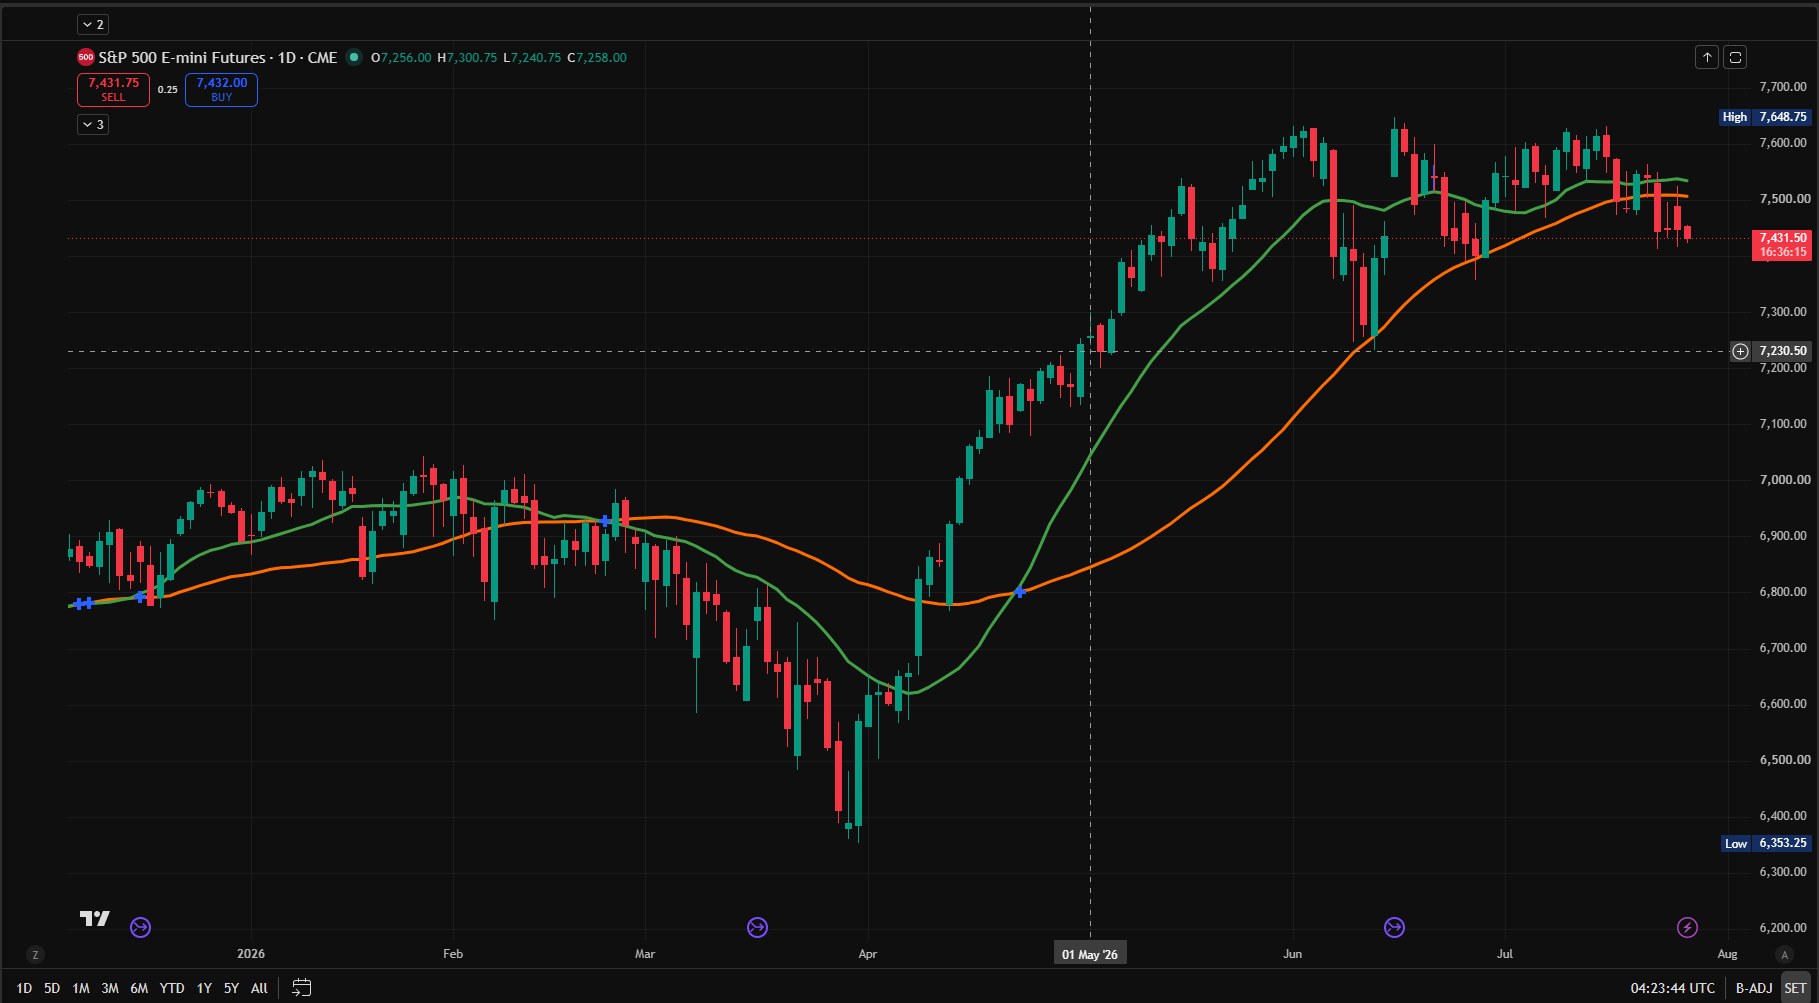
The 50-period and 200-period Exponential Moving Averages (EMAs) are two of the most widely used indicators in technical analysis. Yet many traders use them without fully understanding what each one measures or when to apply them strategically.
What Are EMAs?
An Exponential Moving Average is an average of price over a specific period that gives more weight to recent price action. Unlike a Simple Moving Average that treats all data points equally, an EMA emphasizes newer data.
The 50 EMA represents the average price over the last 50 periods (50 days on a daily chart, 50 hours on an hourly chart).
The 200 EMA represents the average price over the last 200 periods.
What Each EMA Represents
The 50 EMA: This is an intermediate-term trend indicator. It tells you the recent trend direction and is used by swing traders and position traders to identify momentum shifts. When price is above the 50 EMA, the short-term trend is generally up. When below, it’s down.
The 200 EMA: This is a long-term trend indicator. It represents the overall market direction over a longer period. Many professional traders use the 200 EMA as a “major trend filter”—if price is above the 200 EMA, the major trend is up. If below, it’s down.
How to Use the 50 EMA
The 50 EMA is useful for:
Identifying short-term trend direction: Quick glance shows you whether recent momentum is up or down.
Finding pullback levels: In an uptrend, price often bounces off the 50 EMA before continuing higher.
Confirming momentum shifts: When price closes below the 50 EMA after an uptrend, it signals a potential trend change.
Entry and exit signals: Some traders use the 50 EMA cross as a signal to enter or exit positions.
How to Use the 200 EMA
The 200 EMA is useful for:
Identifying major trend direction: Is the long-term trend up or down? The 200 EMA tells you.
Filtering trades: Professional traders often only trade in the direction of the 200 EMA. If the 200 EMA is trending down, they avoid buying signals.
Finding major support and resistance: Price often finds strong support/resistance at the 200 EMA, especially during retracements.
Understanding market structure: Where is the 200 EMA relative to key support/resistance levels? This provides context.
Using Both Together
The real power comes from using the 50 and 200 EMAs together:
Golden Cross and Death Cross: When the 50 EMA crosses above the 200 EMA (Golden Cross), it signals potential uptrend initiation. When the 50 crosses below the 200 (Death Cross), it signals potential downtrend initiation. However, don’t rely on these alone—confirm with price structure.
Distance between the two: The farther apart the 50 and 200 EMAs, the stronger the trend. When they converge, a trend change may be coming.
Price position relative to both: If price is above both EMAs with the 50 above the 200, the trend is strong and up. If price is below both with the 50 below the 200, the trend is strong and down.
Pullback levels: In uptrends, watch for price to bounce between the 50 and 200 EMAs. In downtrends, price often moves between them as well.
Important Cautions
EMAs lag: Both EMAs are lagging indicators. They respond to price movement that has already happened. Don’t rely on them alone to predict the future.
Whipsaws occur: During consolidation or choppy markets, EMAs can generate false signals as they cross repeatedly.
Timeframe matters: The 50 EMA and 200 EMA on a 1-minute chart are vastly different from those on a daily chart. Use the timeframe appropriate for your trading style.
They work best in trending markets: During strong uptrends and downtrends, EMAs are reliable. During ranges and consolidations, they’re less useful.
Practice Exercise
On a daily chart of a market you’re interested in, overlay both the 50 EMA and 200 EMA. Observe:
- What direction is each EMA trending?
- What is the relationship between them (50 above 200, below 200, converging)?
- How often does price bounce off each EMA?
- When price closes through an EMA, what happens next?
Track this for 2-4 weeks and you’ll develop intuition for how these EMAs work in real market conditions.
Final Thoughts
The 50 and 200 EMAs are powerful tools when used correctly, but they’re not magic. They’re best used as one part of a complete analytical framework that includes price structure, support/resistance, and market context.
The traders who master these EMAs don’t memorize crossover signals—they understand what each EMA represents and use that knowledge to make better trading decisions.
SkyVestments content is provided for educational and informational purposes only and is not financial or investment advice. Markets involve risk, and individuals should make their own informed financial decisions.
Educational Disclaimer: SkyVestments content is provided for educational and informational purposes only and is not financial or investment advice. Markets involve risk, and individuals should make their own informed financial decisions.